Home to  33% of the world’s extreme poor

Map of India highlighting its financial disparity, with a yellow circle indicating that the wealthiest 1% of the population owns 22% of the country's wealth, accompanied by an icon of stacked coins with an upward arrow.

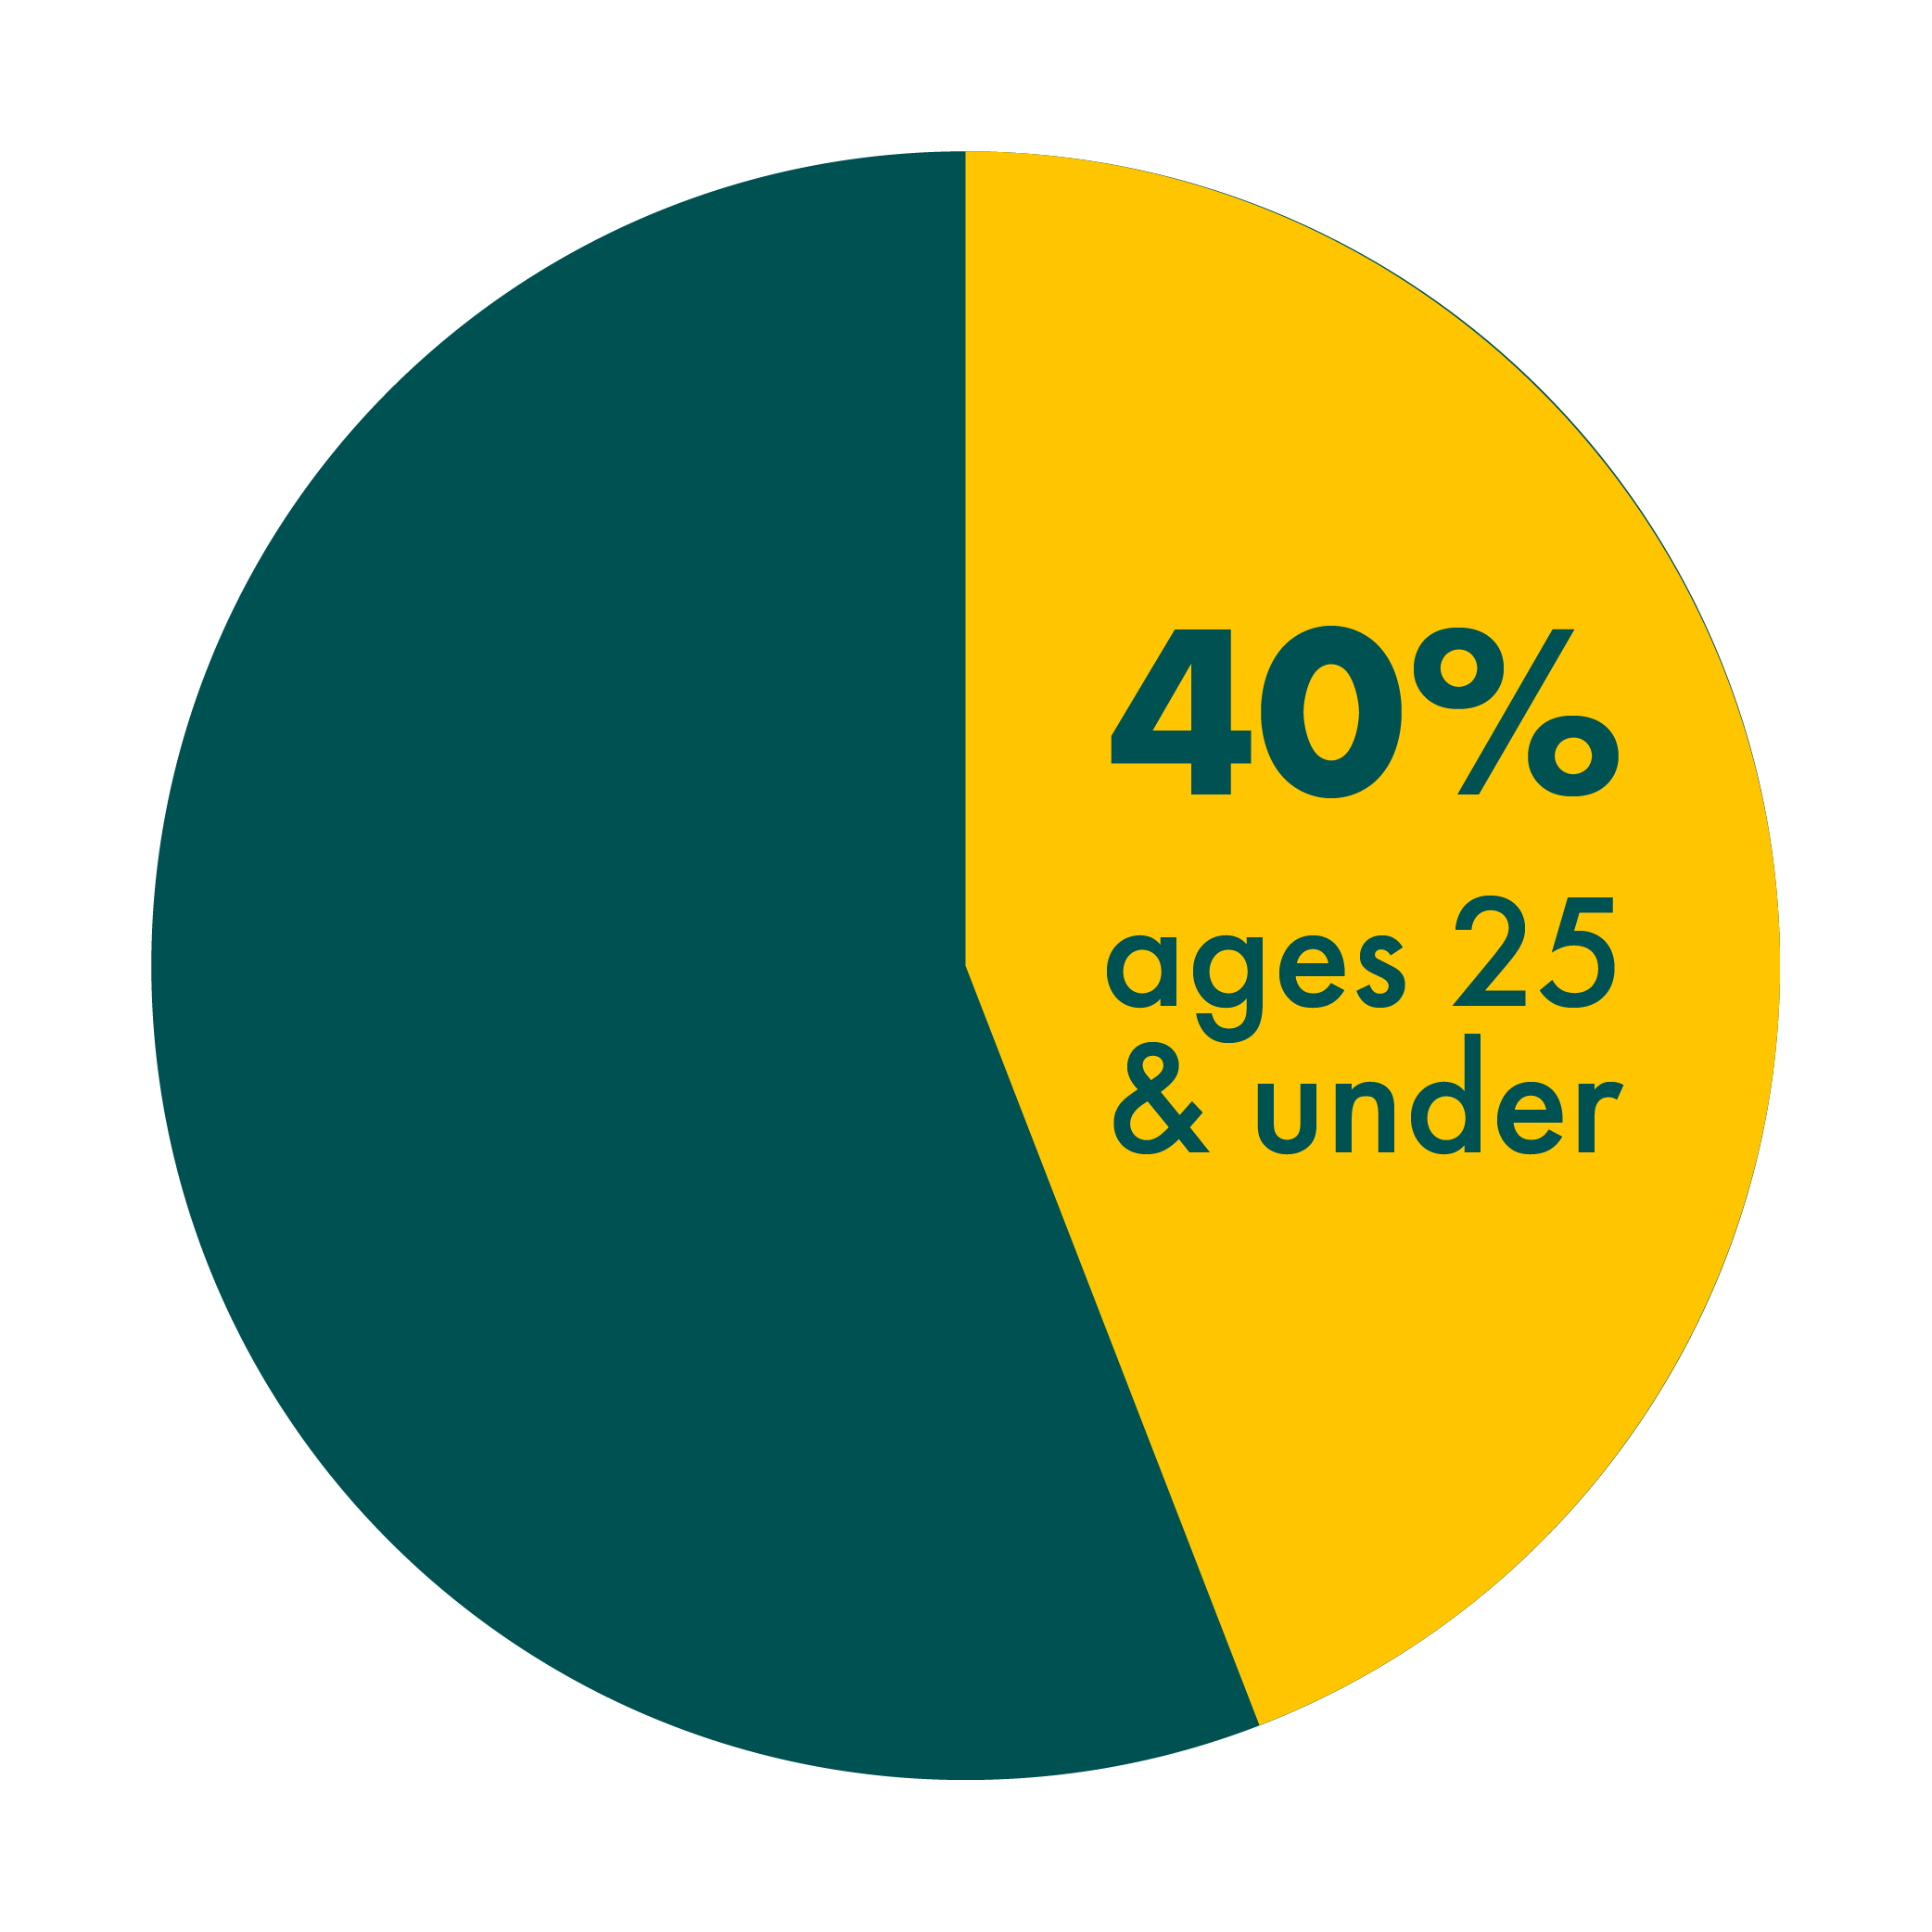
40% of the country’s residents are younger than 25

An illustration of a graduation cap and a diploma with a ribbon, representing academic achievement.

56 million Indians were pushed to extreme poverty in 2020 due to Covid-19

Nearly 27% of prisoners in India are illiterate & 42% have up to a 10th-grade education

Graph showing over 700 ethnic groups with icons representing different groups in various colors and arrangements.
A pie chart showing 33% with an icon of stacked coins and a red downward arrow, overlaid on a world map background.

Gender Discrimination accounts for over 90% of employment & earning gap between males & females

Graphic showing 56 million people compared to a virus illustration, representing COVID-19 global impact.

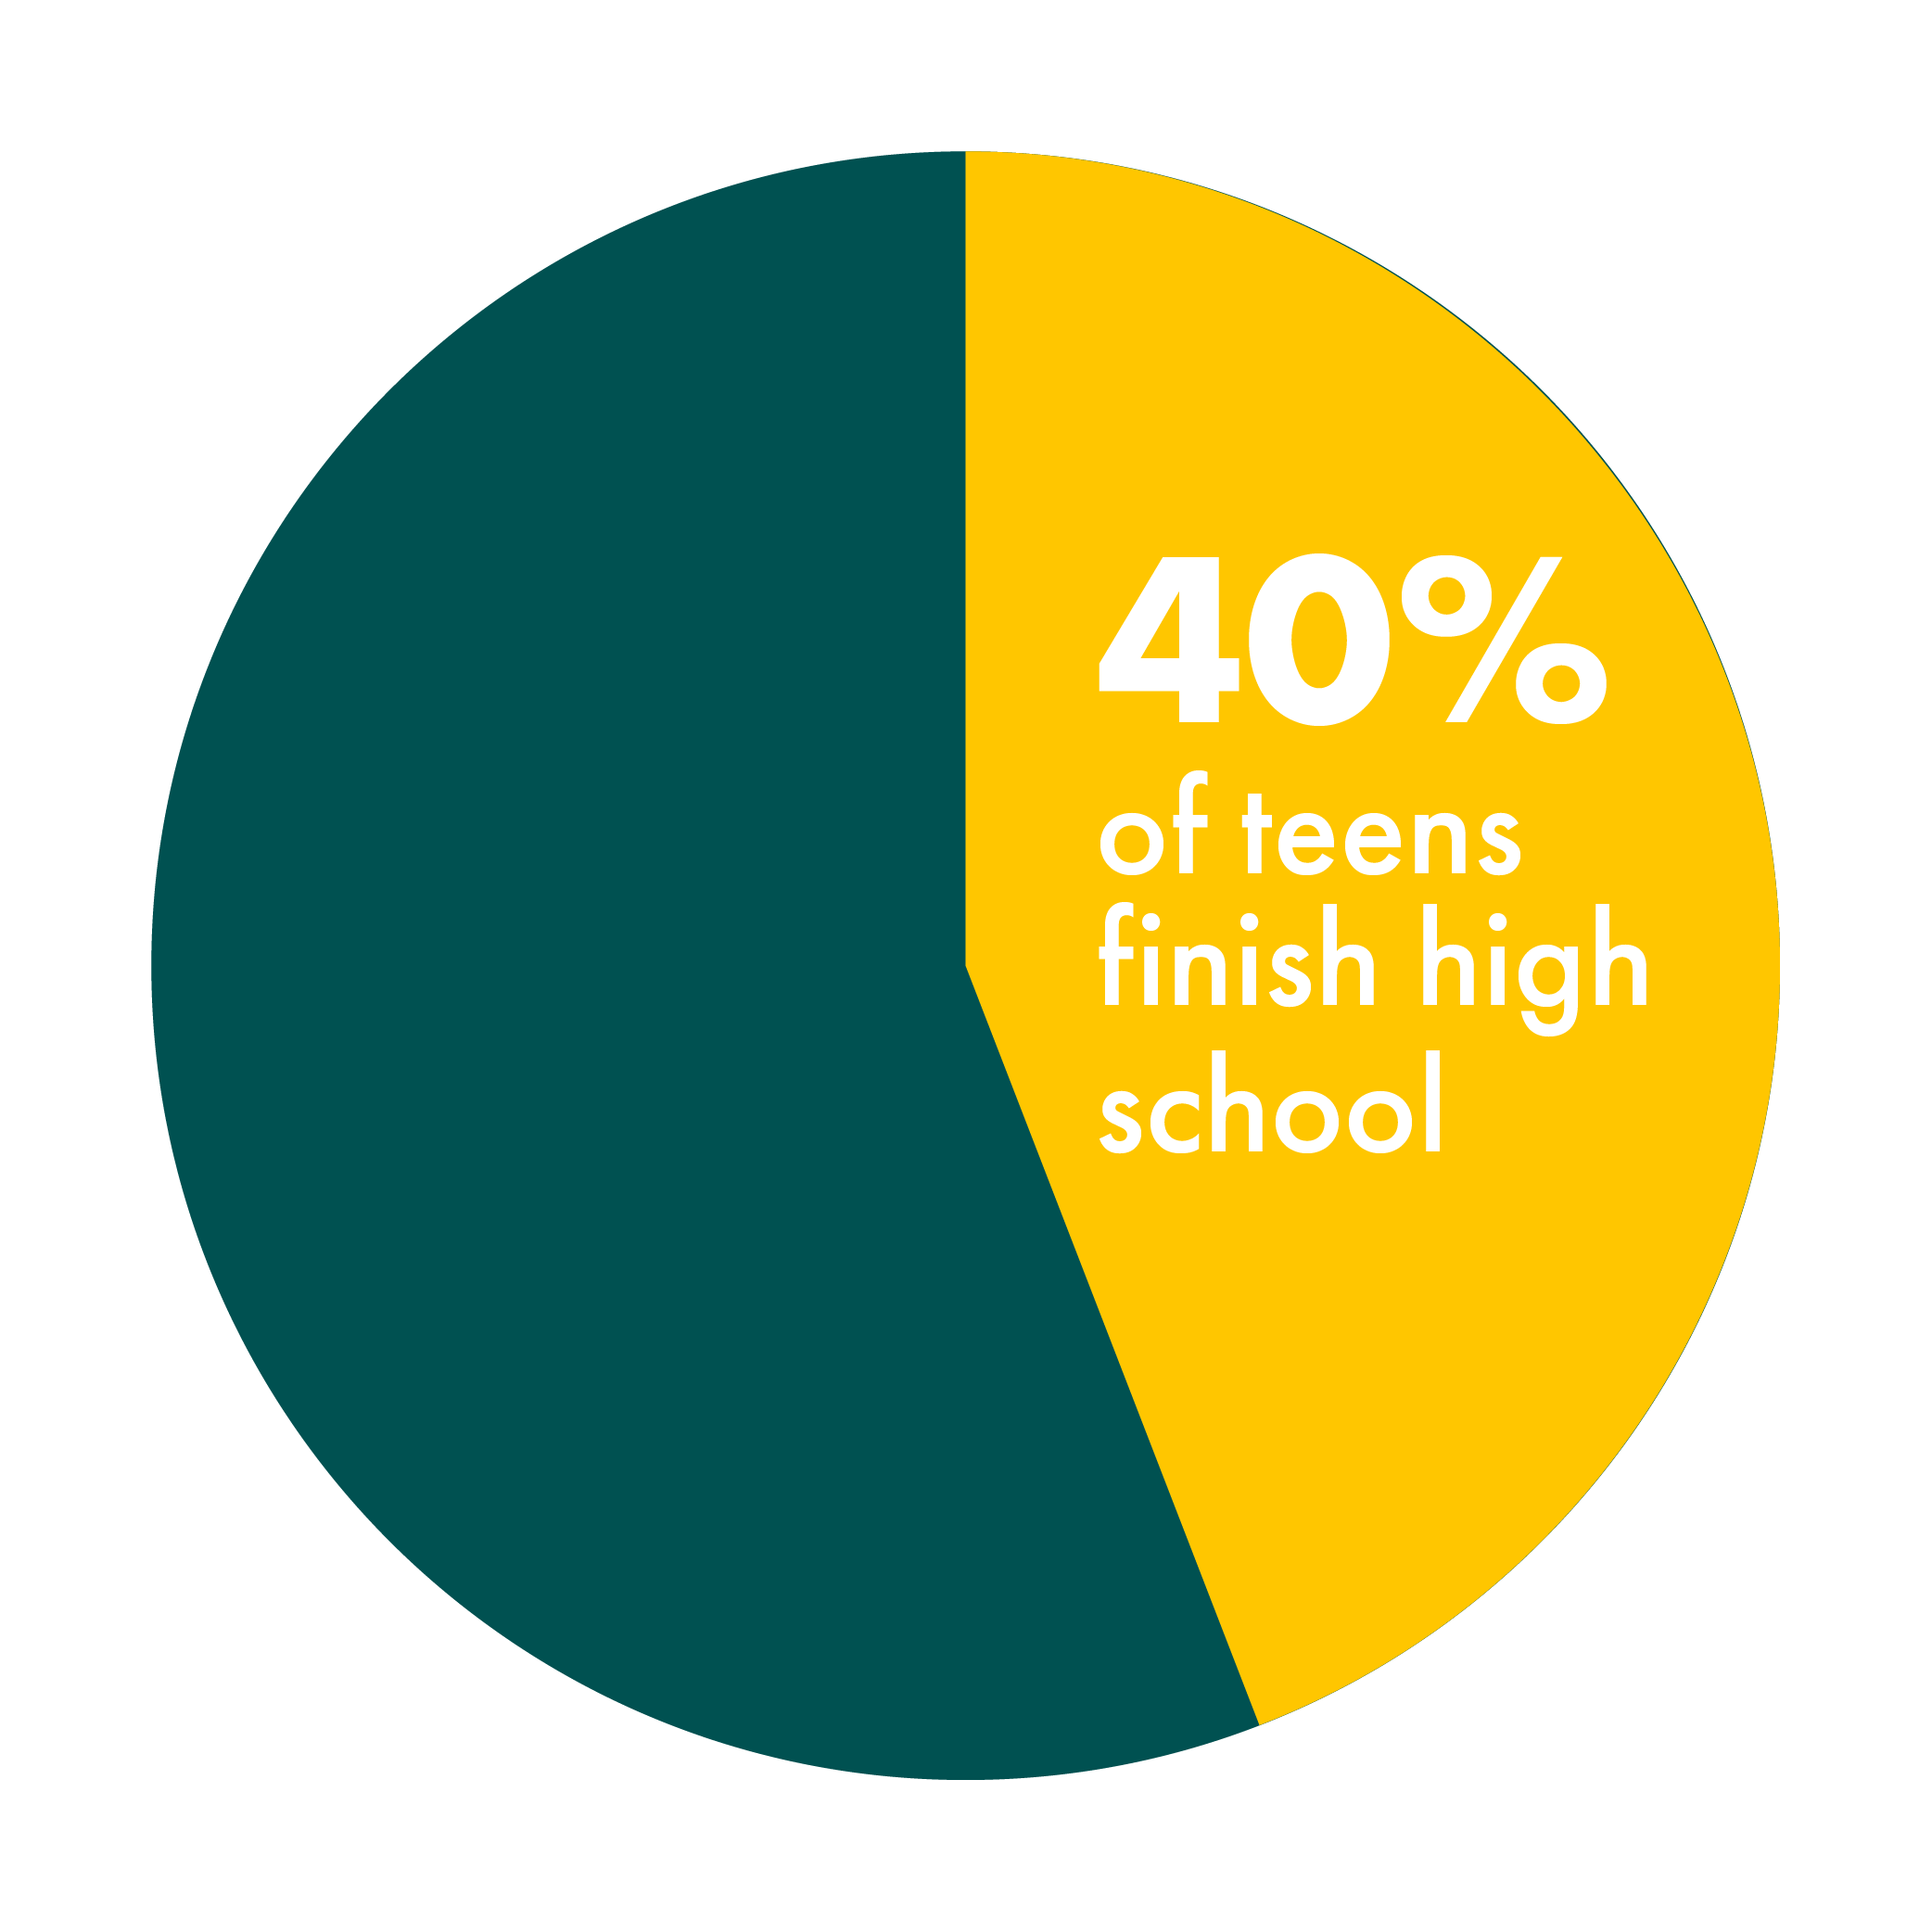
Only 40% of teens in the country finish high school

A bar graph showing 47.8% of women related to a female figure and an unmarked male figure, with a prohibition sign on the right side.

47.8% of children not attending school in India are girls

A semi-circular gauge showing 90%, with pink female gender symbol and blue male gender symbol below.
Pie chart titled 'Prisoners in India' showing three segments: 27% with an icon of a closed book crossed out, 42% with white text 'have up to 10th grade education' on a yellow background, and the remaining segment in dark teal.

India has over 700 ethnic and indigenous people groups

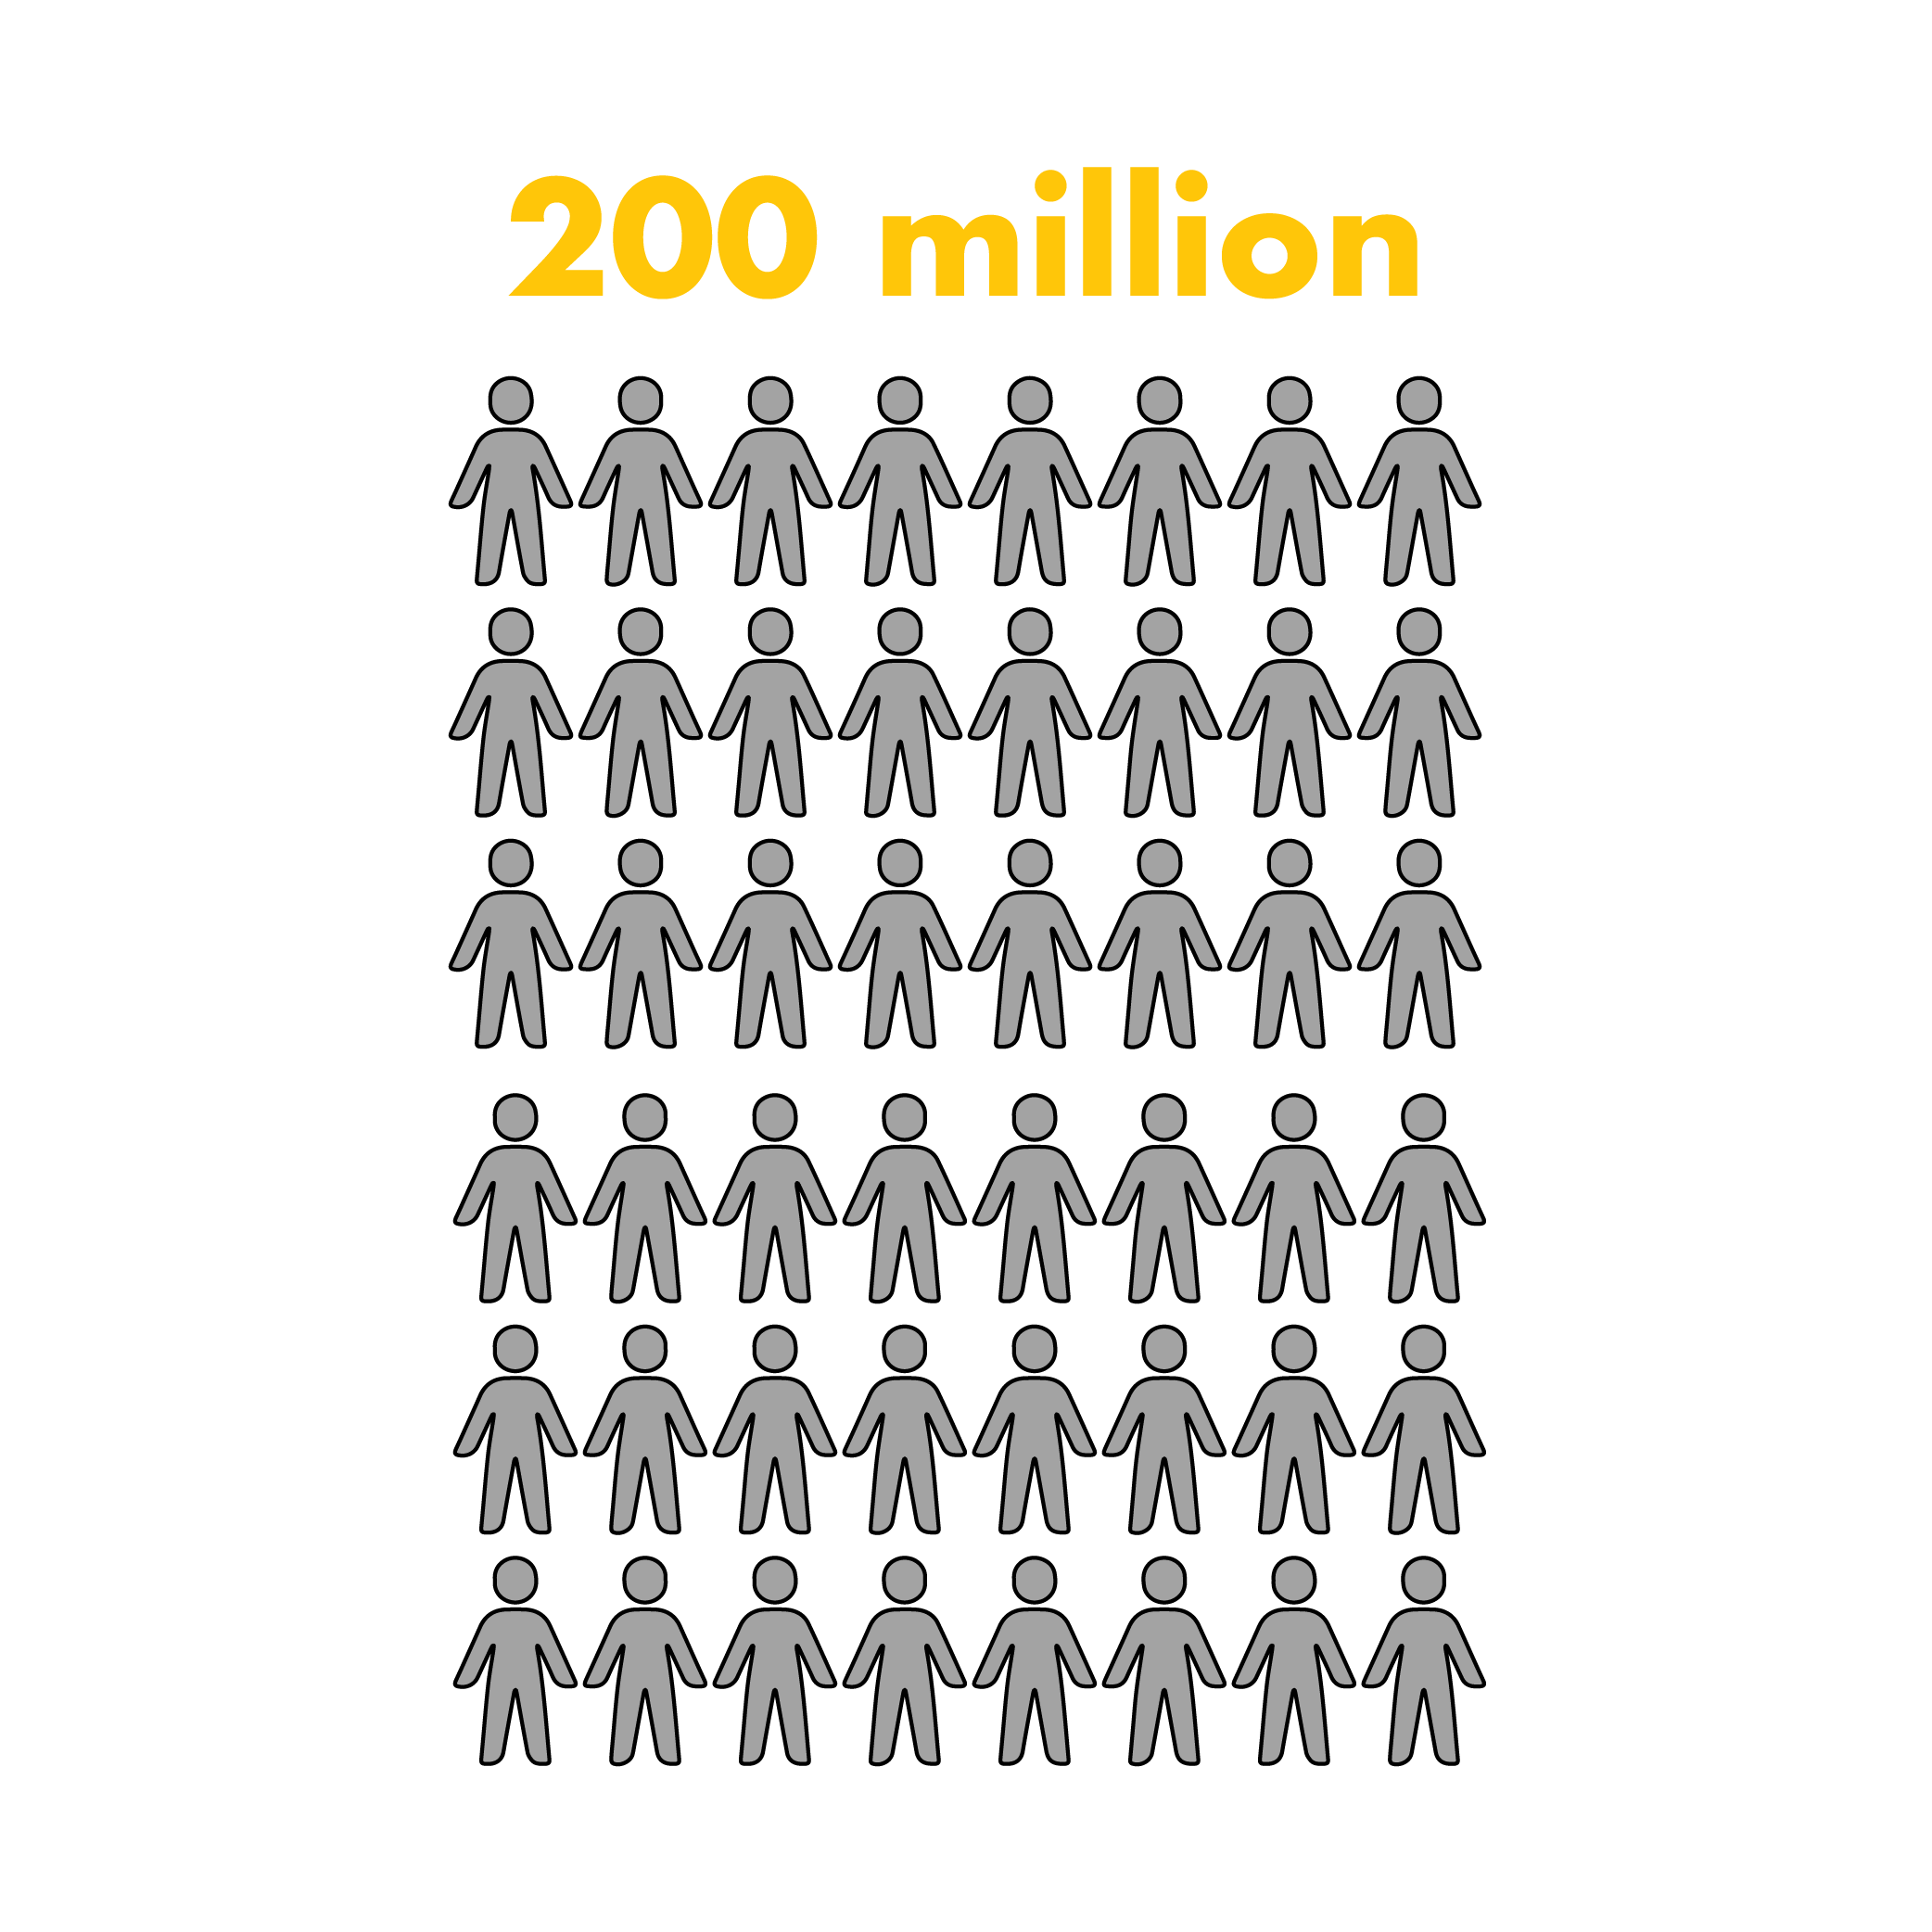
India is home to over 200 million Dalits (“oppressed”) who face social discrimination

Graphic illustrating that 200 million people are affected by a certain issue, represented by 20 rows of 10 gray human icons on a black background, with "200 million" in bold yellow text at the top.

A mere 8.15% of Indians get a college degree

Pie chart showing 40% of teens finish high school, with the section in yellow and the remaining percentage in dark teal.

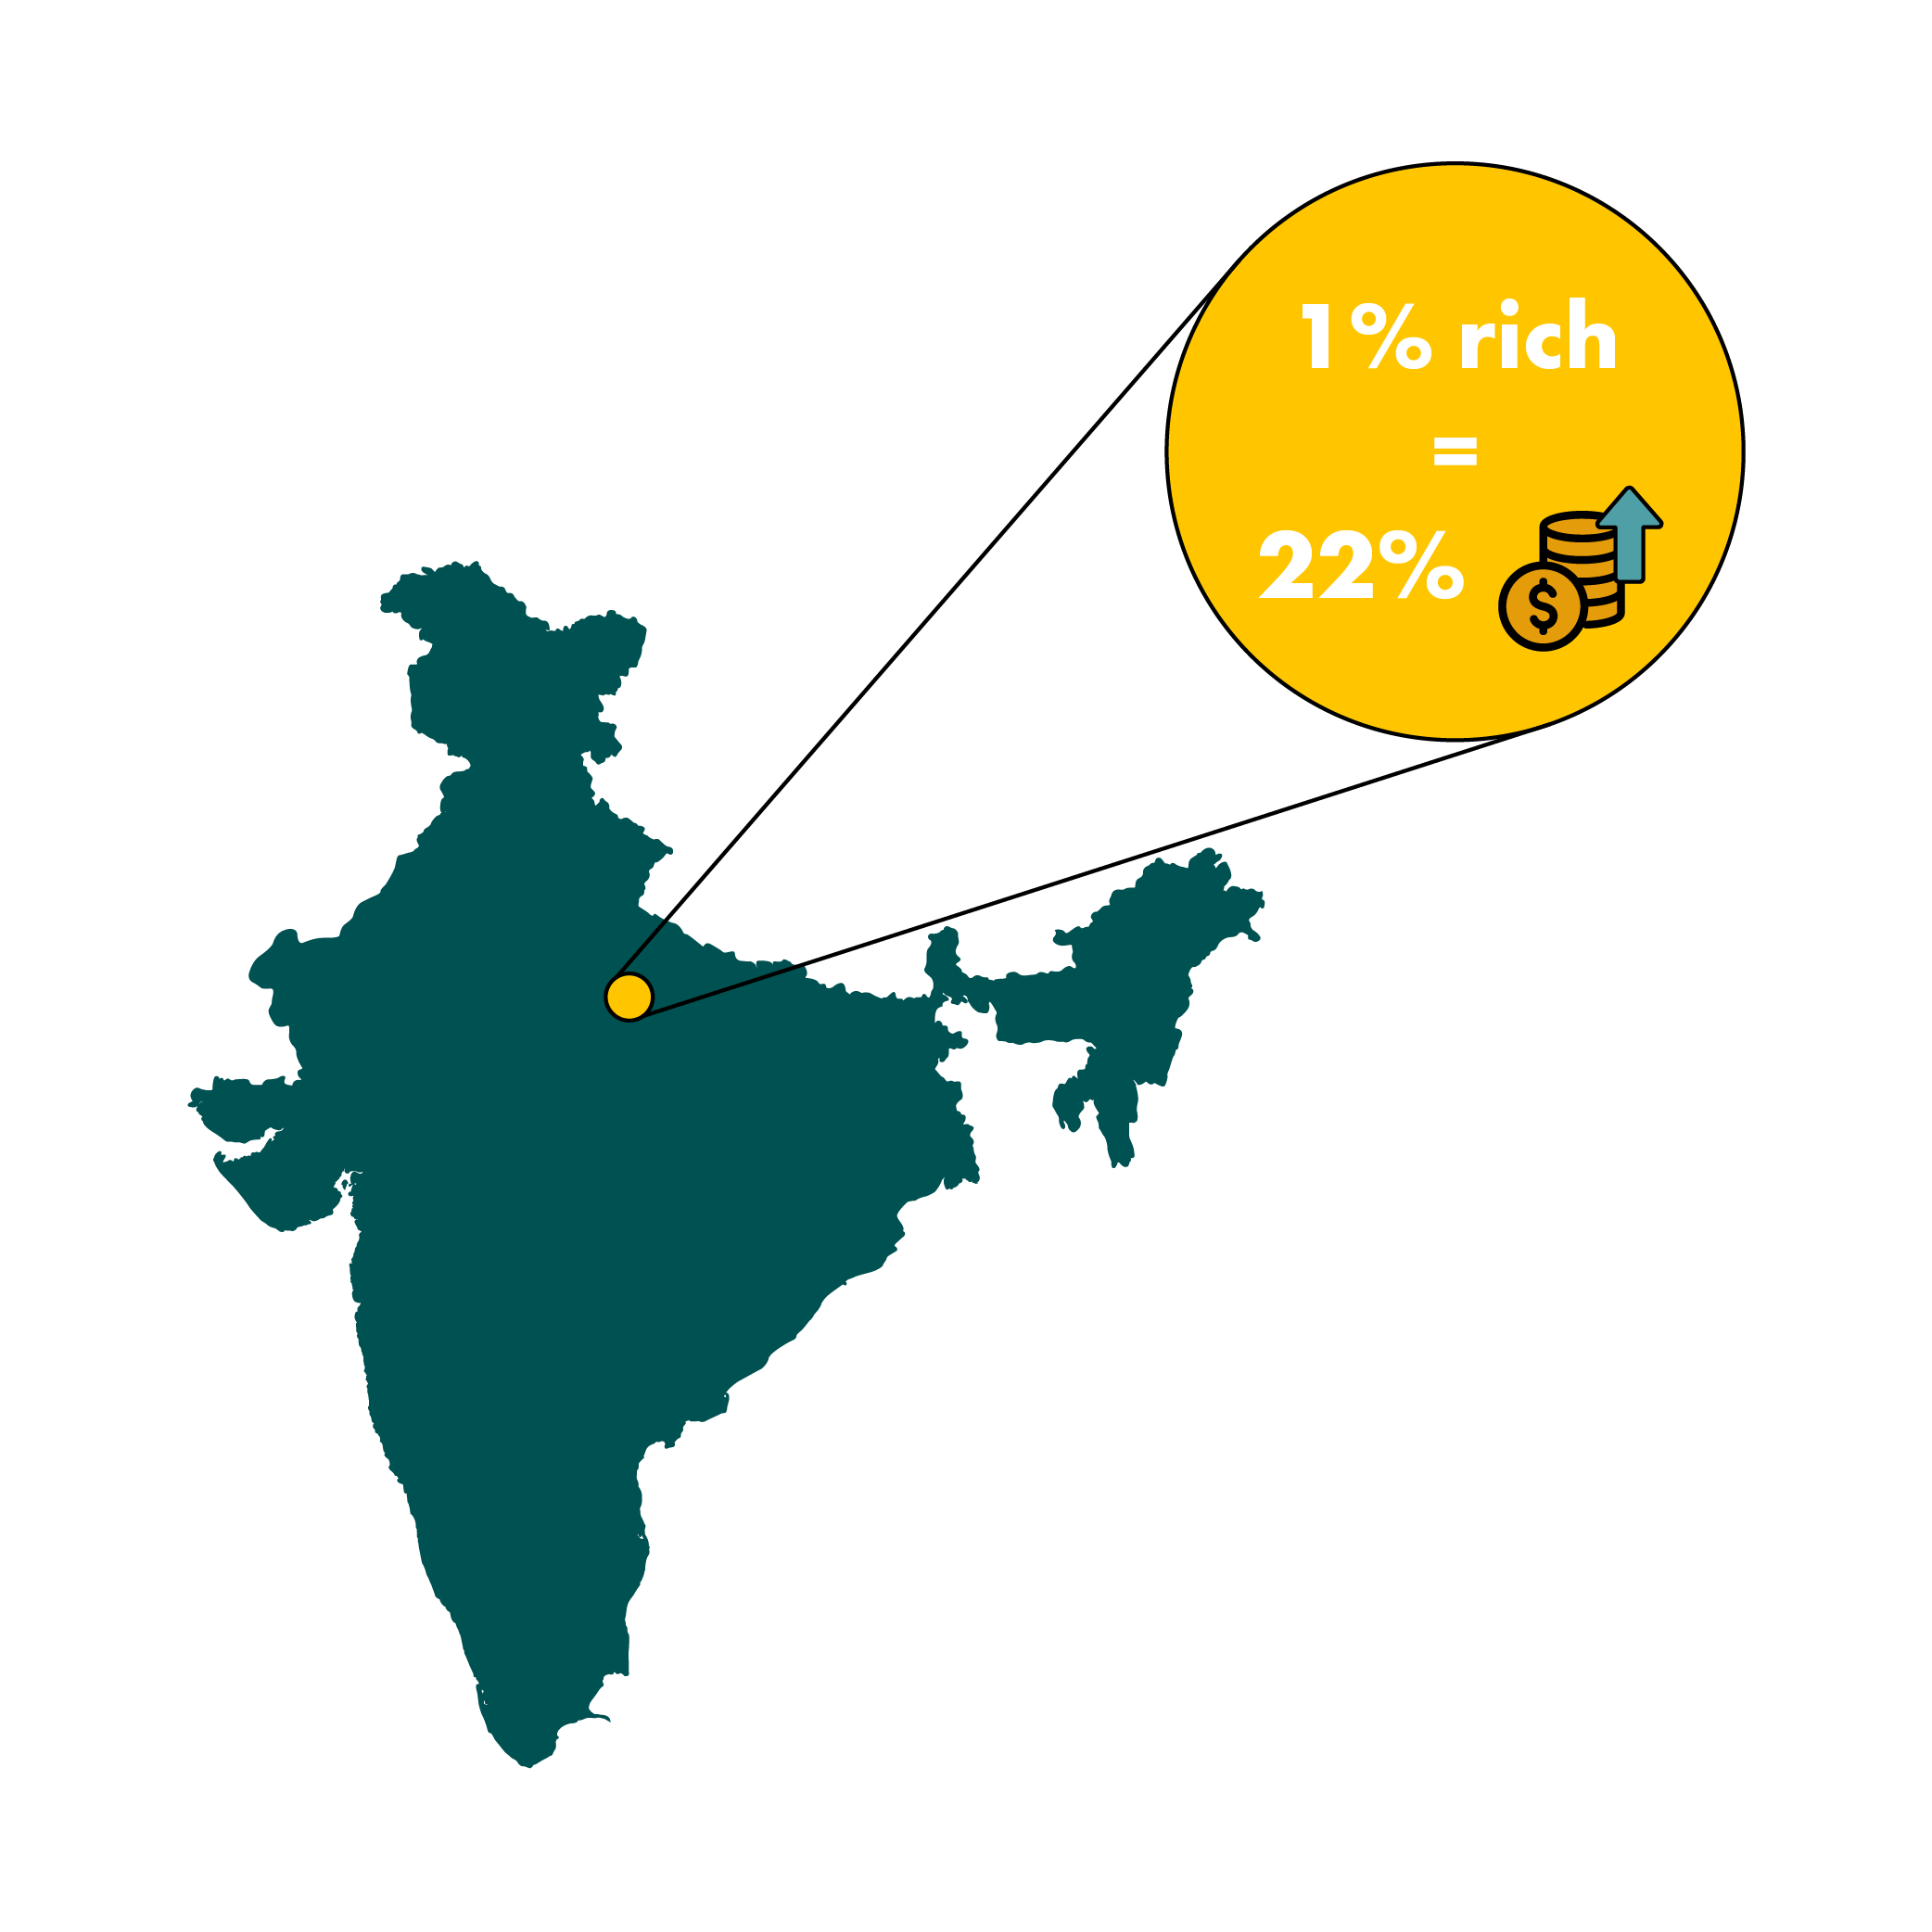
The top 1% rich in India hold 22% of the total national income

Pie chart showing 40% of a group are aged 25 and under.